Python Matplotlib Crash Course
Learn Matplotlib concepts with hands-on live running coding examples and exercises
Amit Diwan
Summary
- Certificate of Completion - Free
- Reed Courses Certificate of Completion - Free
Add to basket or enquire
Overview
Welcome to the Matplotlib Crash Course (2024)!
Matplotlib is an open-source plotting library developed by John D. Hunter. Create interactive visualizations in Python with Matplotlib. It is built on NumPy and is one of the most popular libraries for data visualization in Python.
What you'll learn
- Learn Matplotlib for Data Science and Data Analysis (2024)
- Create interactive visualizations in Python with Matplotlib.
- Easily create graphs, histograms, bar graphs, etc.
- Learn Matplotlib from scratch
- Acquire essential Matplotlib skills for numeric and scientific computing
Certificates
Certificate of Completion
Digital certificate - Included
Reed Courses Certificate of Completion
Digital certificate - Included
Will be downloadable when all lectures have been completed.
Curriculum
Course media

Description
In this tutorial, we will learn how to perform plotting with Python Matplotlib. Visualizations are far better than textual data. Using matplotlib, we can easily create graphs, histograms, bar graphs, etc. The course is useful for Data Scientists and Analysts.
Features
The following are the features of Matplotlib:
- Free and open-source Python library
- Load and plot the data easily
- Easily Make interactive figures that can zoom, pan, update.
- Export to various file formats, such as PNG, PDF, SVG, etc.
- Use third-party packages built on Matplotlib for plotting, animations, styles, etc.
- Create graphs easily, set legends, position titles, plot, etc. with Matplotlib
Course Lessons
- Matplotlib – Introduction
- Install & Matplotlib
- Matplotlib - PyPlot Submodule (Run first Matplotlib program)
- Matplotlib - Plotting
- Matplotlib - Add Grid Lines
- Matplotlib - Add Labels to a Plot
- Matplotlib - Plot Titles and Position them
- Matplotlib - Add a Legend in a Graph
- Matplotlib - Position Legends
- Matplotlib - Change the background color of the Legend
- Matplotlib - Change the font size of the Legend
- Matplotlib – Bar Graph
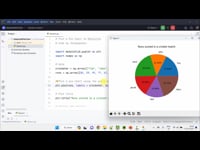
- Matplotlib – Pie Chart
- Matplotlib – Line Graph
- Matplotlib – Histogram
- Matplotlib – Scatter Plot
Hit the Enroll Button!
Who is this course for?
- Python Libraries Beginners
- Data Visualization Beginners
- Data Science Beginners
- Get started with Matplotlib
- Those who want to learn Matplotlib by doing. This course includes 50+ hands-on exercises
- Gain a deep understanding of Python Matplotlib
Requirements
- A computer with an Internet
- Python knowledge
- Passion to learn Matplotlib
Career path
The Average Data Scientist's salary in the UK is £73,411
The Average Data Analyst salary in the UK is £41,449
Questions and answers
Currently there are no Q&As for this course. Be the first to ask a question.
Reviews
Currently there are no reviews for this course. Be the first to leave a review.

Add to basket or enquire
Course provided by
Legal information
This course is advertised on reed.co.uk by the Course Provider, whose terms and conditions apply. Purchases are made directly from the Course Provider, and as such, content and materials are supplied by the Course Provider directly. Reed is acting as agent and not reseller in relation to this course. Reed's only responsibility is to facilitate your payment for the course. It is your responsibility to review and agree to the Course Provider's terms and conditions and satisfy yourself as to the suitability of the course you intend to purchase. Reed will not have any responsibility for the content of the course and/or associated materials.