Bundle Course - BI Tools (Tableau, Power BI, SAP BO)
Self-paced videos, Lifetime access, Study material, Certification prep, Technical support, Course Completion Certificate
Summary
- Reed courses certificate of completion - Free
- Uplatz Certificate of Completion - Free
Add to basket or enquire
Overview
Uplatz offers this comprehensive bundle course on BI Tools consisting of a combo of video courses on all topics that are associated with the leading Analytics & BI Tools viz. Tableau, Power BI, SAP BO. You will be awarded Course Completion Certificate at the end of the course.
Bundle Course Bi Tools
The Bundle Course Of BI tools includes 3 individual modules of course :
- Tableau
- Power BI
- SAP BusinessObjects Business Intelligence
Tableau : Tableau is a Business Intelligence tool for visually analyzing the data. Users can create and distribute an interactive and shareable dashboard, which depict the trends, variations, and density of the data in the form of graphs and charts. Tableau can connect to files, relational and Big Data sources to acquire and process data. The software allows data blending and real-time collaboration, which makes it very unique. It is used by businesses, academic researchers, and many government organizations for visual data analysis. It is also positioned as a leader Business Intelligence and Analytics Platform in Gartner Magic Quadrant.
Power BI: Power BI is a Data Visualization and Business Intelligence tool that converts data from different data sources to interactive dashboards and BI reports. Power BI suite provides multiple software, connector, and services - Power BI desktop, Power BI service based on Saas, and mobile Power BI apps available for different platforms. These set of services are used by business users to consume data and build BI reports. This tutorial covers all the important concepts in Power BI and provides a foundational understanding on how to use Power BI.
SAP BusinessObjects Business Intelligence : The SAP® BusinessObjects™ Business Intelligence (BI) platform is a flexible, scalable information infrastructure that helps you more easily discover and share insights for better business decisions. The integrated, unified infrastructure enables scalability from one to many tools and interfaces on premise, in the cloud, or as a hybrid approach.
Certificates
Reed courses certificate of completion
Digital certificate - Included
Will be downloadable when all lectures have been completed
Uplatz Certificate of Completion
Digital certificate - Included
Course Completion Certificate by Uplatz
Curriculum
Course media

Description
Bundle Course – BI Tools - Course Syllabus
Tableau – Course Syllabus
Tableau History, Interface and Components
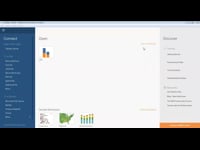
Connecting to databases and preparing data
Data Refresh and Blending
Sorting
Grouping
Creating Sets
Filters
Filter shelves
Quick Filter
Parameters
Formatting
Trend Lines and reference lines
Drills
Introduction to Dashboards and Story
Building dashboards
Layouts and Formatting
Interactivity
StoryPoints
Maps
Background Images
Calculations Syntax
Modifying Table calculations
Aggregations and LOD Expressions
Power BI Syllabus
Power BI Complete Introduction
- Power BI Introduction
- Data Visualization, Reporting
- Business Intelligence(BI), Traditional BI, Self-Serviced BI
- Cloud Based BI, On Premise BI
- Power BI Products
- Power BI Desktop (Power Query, Power Pivot, Power View)
- Flow of Work in Power BI Desktop
- Power BI Report Server, Power BI Service, Power BI Mobile
- Flow of Work in Power BI / Power BI Architecture
- A Brief History of Power BI
PBI Desktop Installation, PBI Desktop &Service Overview
- Power BI Desktop Installation
- Building Blocks of Power BI
- Datasets, Visualizations, Reports, Dashboards, Tiles
- Power BI Desktop User Interface
- Fields Pane, Visualizations pane, Ribbon, Views, Pages Tab, Canvas
- Overview of Power Query / Query Editor – Extract, Transform & Load Data
- Connecting to Data Sources, Establish connection to the Excel source
- Importing Data into Power BI or Query Editor
- Transforming the Data using Power Query
- Model the Data using Power Pivot – Relationship View
- Creating New Measures and New Columns using DAX – Data View
- Visualizing the Data using Power View and Power Maps – Report View
- Saving and Publishing the Visuals or Reports
- Logon to Power BI Service
- View the Reports in PBI Service and Share the reports
Power Query
Introduction to Power Query – Extract, Transform & Load
- Data Transformation, Benefits of Data Transformation
- Shape or Transform Data using Power Query
- Overview of Power Query / Query Editor, Query Editor User Interface
- The Ribbon (Home, Transform, Add Column, View Tabs)
- The Queries Pane, The Data View / Results Pane, The Query Settings Pane, Formula Bar
- Advanced Editor – Complete ETL Code
- Saving Your Work – Appling ETL Changes – Loading into Power Pivot Model
- Power Query Conceptually
Datatypes and Filters in Power Query
- Datatypes, Changing the Datatype of a Column
- Filters in Power Query
- Auto Filter / Basic Filtering
- Filter a Column using Text Filters
- Filter a Column using Number Filters
- Filter a Column using Date Filters
- Filter Multiple Columns
Inbuilt Column Transformations
- Remove Columns / Remove Other Columns
- Name / Rename a Column
- Reorder Columns or Sort Columns
- Add Column / Custom Column
- Split Columns
- Merge Columns
- PIVOT, UNPIVOT Columns
- Transpose Columns
In built Row Transformations
- Header Row or Use First Row as Headers
- Keep Top Rows, Keep Bottom Rows
- Keep Range of Rows
- Keep Duplicates, Keep Errors
- Remove Top Rows, Remove Bottom Rows, Remove Alternative Rows
- Remove Duplicates, Remove Blank Rows, Remove Errors
- Group Rows / Group By
Combine Queries (Append Queries & Merge Queries)
Append Queries / Union Queries
- Append Queries
- Append Queries as New
- Append 2 or more files individually with different queries
- Appending multiple files of same type from a folder using single query
- Query Options
- Copy Query, Paste Query
- Delete Query, Rename Query
- Enable Load, Include in report Refresh
- Duplicate Query, Reference Query
- Move to Group, Move Up, Move Down
Enhancing the Data Model – DAX
- What is DAX, Calculated Column, Measures
- DAX Table and Column Name Syntax
- Creating Calculated Columns, Creating Measures
- Implicit Vs Explicit Measures
- Calculated Columns Vs Measures
- DAX Syntax & Operators
- DAX Operators
- Types of Operators
- Arithmetic Operators, Comparison Operators, Text Concatenation Operator, Logical Operators
SAP BUSINESSOBJECTS BUSINESS INTELLIGENCE
- Introduction:
- Understanding BusinessObjects Enterprise
- What is BusinessObjects Enterprise?
- Working with SAP BO Launchpad (Infoview)
- SAP Business Objects Web Intelligence and BI Launch Pad 4.1
- SAP Business Objects Dashboards 4.1
- BI launch pad: What’s new in 4.1
- Restricting data returned by a query
- Enhancing the presentation of data in reports
- Formatting reports
- Calculating data with formulas and variables
- Using multiple data sources
- Analyzing data
- Managing and sharing Interactive Analysis documents
- Reporting from Other Data Sources
- Introducing Web Intelligence
- Accessing corporate information with Web Intelligence
- Understanding how universes allow you to query databases using everyday business terms.
- Managing documents in InfoView
- Viewing a Web Intelligence document in InfoView
- Setting Info View Preferences
- Creating Web Intelligence Documents with Queries
- Getting new data with Web Intelligence
- Creating a new Web Intelligence document
Who is this course for?
Everyone
Requirements
Passion and determination to achieve your goals!
Career path
- Data Analyst
- MI/BI Analyst
- Dashboard Developer
- Tableau Developer
- Financial Data Analyst (Tableau Developer)
- Power Bi Developer
- Power BI Trainer
Questions and answers
Currently there are no Q&As for this course. Be the first to ask a question.
Reviews
Currently there are no reviews for this course. Be the first to leave a review.
Provider
Uplatz is leading global provider of IT & Technology training.
We have a strong network of qualified and experienced tutors. Uplatz provides training on cutting-edge technologies such as Data Science, Machine Learning, AWS, Microsoft Azure, Google Cloud, IBM Cloud, Data Engineering, Python, R, Java, SAP, Oracle, SAS, Salesforce, Web Development Stack, JavaScript, ReactJS, AngularJS, NodeJS, JSP & Java Servlets, MongoDB, BI Tools such as Tableau, Spotfire, Power BI, DW & ETL tools such as Informatica, IBM DataStage, Talend, DevOps, Project Management, Software Testing, and many more.
We provide training courses in both online formats - 1) live tutor-led, 2) self-paced videos
We feel proud to say that we are making learning affordable by keeping prices of all our courses very low. Our course prices are listed at almost 90% discounted rate from average market price.
Our Vision
- To become a global leader in the learning sector by providing training on job-oriented technologies
Our Mission
- To provide high-quality training on industry-demanded technologies
- To make learning affordable for the masses by keeping our prices extremely low
- To help our talented students get a high-paying job in the market
Will I get a Certificate of Course Completion?
Course Completion Certificate is awarded by Uplatz
What are your top courses?
- Data Science
- Machine Learning
- Cloud Computing - AWS, Azure, Google Cloud, IBM Cloud, and more
- Data Engineering
- SAP modules such as S/4HANA Finance, EWM, TRM, FICO, BPC, HCM, WM, MM, PP, PM, QM, SD, TRM, SuccessFactors, UI5 and Fiori, S/4HANA Logistics, TM, etc.
- Oracle
- SAS
- Salesforce
- BI Tools - Tableau, Power BI, Spotfire, MicroStrategy, etc.
- DW & ETL Tools - Informatica, Talend, IBM DataStage, etc.
- Project Management & DevOps
- Software Testing
- Digital Marketing & SEO
Will I be provided study material, tutor notes and practice assignments?
Uplatz provides tutor notes, practice assignments, practice sessions, and a lot of useful study material for free. This will help you in job interviews and certification exams.
In case of tutor-led online training, will I have access to the recorded sessions?
Yes. All live classes get recorded and life-time access on the recordings is provided.
Course Search and Enrollment
Simply search the course of your choice! We have a portfolio of more than 1000 courses with the premium ones highlighted clearly. Just search for the course that you want to take or simply use our online course finding tool to help you choose the best courses as per your needs and market demand.
Uplatz differentiates itself by providing extremely affordable learning to all and that too in the comfort of their homes.
Just contact us for a customized quote, your preferable timings, your affordability, and we'll work out the best course for you that will provide you not only a great return on investment but also to help you get a job with a premium salary. We'll also get you prepared for the certification exams.

Add to basket or enquire
Legal information
This course is advertised on Reed.co.uk by the Course Provider, whose terms and conditions apply. Purchases are made directly from the Course Provider, and as such, content and materials are supplied by the Course Provider directly. Reed is acting as agent and not reseller in relation to this course. Reed's only responsibility is to facilitate your payment for the course. It is your responsibility to review and agree to the Course Provider's terms and conditions and satisfy yourself as to the suitability of the course you intend to purchase. Reed will not have any responsibility for the content of the course and/or associated materials.