Qlik Sense MasterClass (Beginner, Intermediate, Advanced)
Qlik Sense Load Script + Visualizations
Summary
- Certificate of completion - Free
- Reed courses certificate of completion - Free
Add to basket or enquire
Overview
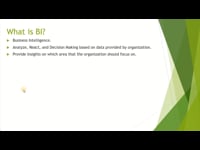
Today, we are all surrounded with full of data.
Data is everywhere but if we do not transform the data into useful insight, we are not able to make the correct decision on a certain matter.
Imagine if we are recently appointed to be a director of an organization, are we able to:
1. React based on the latest or historical information that is happening around us?
2. Reduce or automate the manual works that have been done in decades?
3. Draw insights from a stack of printed reports?
If you do not have the answer, join this class to know more about Qlik Sense which can help solve your problems.
Certificates
Certificate of completion
Digital certificate - Included
Reed courses certificate of completion
Digital certificate - Included
Will be downloadable when all lectures have been completed
Curriculum
Course media

Description
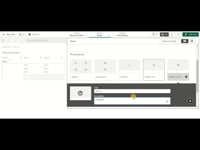
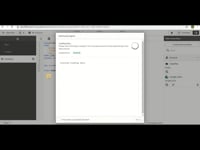
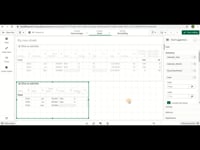
In the Intermediate session, you will be exposed to the load script where we load our data into Qlik Sense.
And also did some of the basic transformations.
Once we have all the tables transformed and saved into QVD formats, we will load all the QVDs back into the load script.
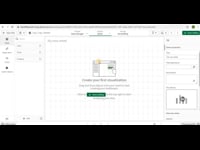
And finally, we will load the data model into our final application, which is the dashboard layer.
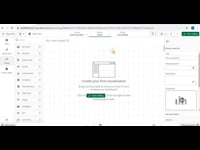
Next, we will go into the Sheets to expose ourselves to visualization expressions, how to create buttons, and also the idea of having master dimension, master expressions, and master visualizations in the dashboard.
For the Advanced session, we will guide you on how to build our load scripts with Master Calendar and Fiscal Calendar, YTD tables, and so on.
Once the load script is completed, we will move on to the sheets to know how do we apply the flags created in the load script into the visualization expression.
A more simplified way to create MTD/YTD logic will be introduced at this session as well.
Functions such as Rank and AGGR are also introduced in the advanced session.
Together with all the knowledge that we learned so far, we will create a 100% chart which will be an interesting chart to showcase the distribution of the specific dimensions that we are interested in.
Thanks for enrolling and Happy Qliking!
Who is this course for?
This course is suitable for those who wants to venture into Business Intelligence Industry, IT fresh graduates, Data Analyst, and so on.
Requirements
No requirements are required. All students are welcomed.
Career path
Business Analyst, BI Developer, BI Analyst, Data Analyst
Questions and answers
Currently there are no Q&As for this course. Be the first to ask a question.
Reviews
Provider
I have been in BI Industry for 4 years. In my past experience, I have being with a Qlik partner organization which helped me in gaining experience on developing some of the Qlik products, namely QlikView, Qlik Sense, and NPrinting. And I would like to share my knowledge as a developer with everyone here. Hopefully you will find my class informative for your learning.

Add to basket or enquire
Legal information
This course is advertised on Reed.co.uk by the Course Provider, whose terms and conditions apply. Purchases are made directly from the Course Provider, and as such, content and materials are supplied by the Course Provider directly. Reed is acting as agent and not reseller in relation to this course. Reed's only responsibility is to facilitate your payment for the course. It is your responsibility to review and agree to the Course Provider's terms and conditions and satisfy yourself as to the suitability of the course you intend to purchase. Reed will not have any responsibility for the content of the course and/or associated materials.